Question: An appliance store wants to conduct an experiment to determine the effect of advertising on sales...
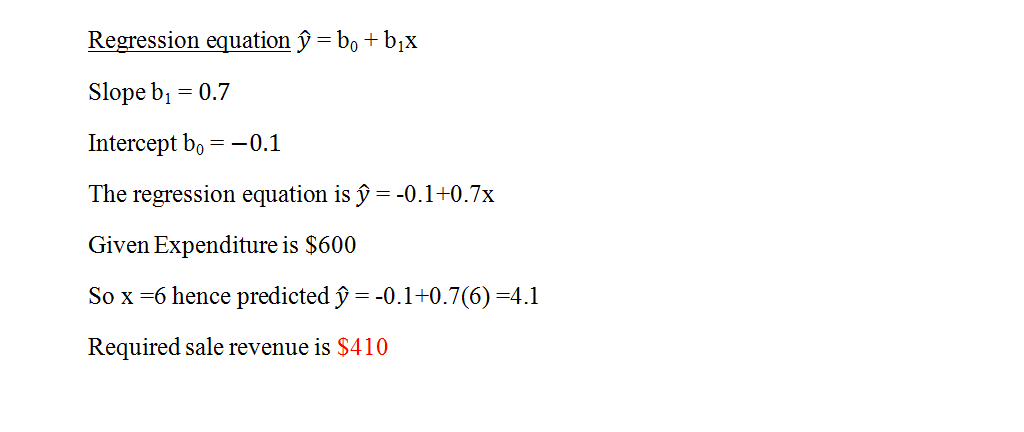
An appliance store wants to conduct an experiment to determine the effect of advertising on sales revenue. The data table contains the advertising expenditure (in $100s) and sales revenue (in $100s) in the past 5 months. Below the data table, you will see the results of the regression analysis that was performed using Excel. You need to decide what the sales revenue will be with an advertising expenditure of $600, if possible. Would you be able to use the regression equation to predict the sales revenue? If so, what will be the sales revenue rounded to the nearest dollar? Support your answer.
Advertising expenditure ($100s) | Sales Revenue ($100s) |
1 | 1 |
2 | 1 |
3 | 2 |
4 | 2 |
5 | 4 |
Coefficients | Standard Error | t Stat | P-value | |
Intercept | -0.1 | 0.635085296 | -0.157459164 | 0.88488398 |
X Variable 1 | 0.7 | 0.191485422 | 3.655630775 | 0.035352847 |


ليست هناك تعليقات:
إرسال تعليق